Overcoming skepticism, putting AI to work
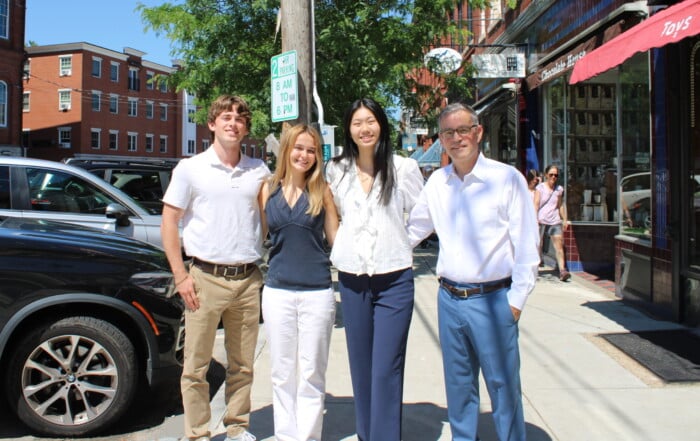
At Blueline Advisors in Exeter, chief investment officer Frank Sabin is embracing AI, with the help of the students, to better serve his clients, who have entrusted about $250 million in assets in his care.
For several months I have been commenting on job formation – specifically, the lack thereof. Several people have told me I am being too negative and that the economy is really OK. Of course, others think we are about to walk over a precipice into economic doom.
This whole job picture has been confusing because the data doesn’t agree. The two federal government monthly job surveys, one of employers and one of households, have been way out of whack for at least six months. So what is going on?
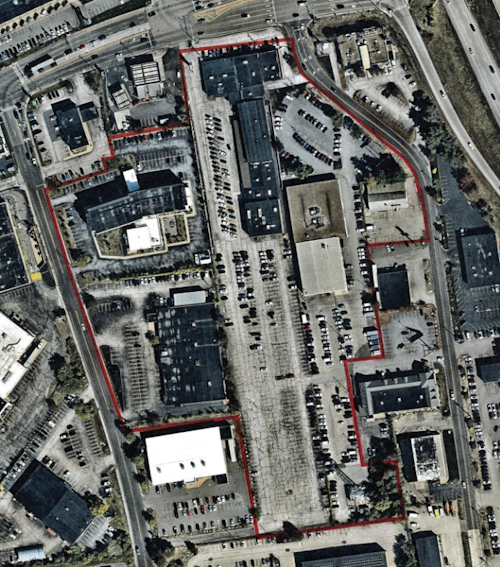
First, occupancy of office space. In 2002, absorption of office space was negative (vacancy rates were increasing). In 2003, there was a slightly positive absorption of about 20 million square feet. That sounds impressive, but the national office space inventory is huge. Today there is reputed to be about 20 million square feet of office space vacant in greater Boston (including Route 128 and perhaps parts of Interstate 495).
Absorption of office space increased in 2004, is predicted to increase more in 2005 and then decline somewhat in 2006. This projection comes from the RCA report of the National Association of Realtors’ Commercial Alliance.
The other side of the coin is vacancy rates. In 2002, national office vacancies were about 17 percent. They increased to over 18 percent in 2003 and are projected to return to 17 percent in 2004, then drop to 16 percent in 2005 and perhaps 15 percent in 2006. So while the trend is still good, the total square-foot vacancy is still a very large number, something like 90 million to 100 million square feet.
The average office density is about four people per 1,000 square feet, which includes common areas (reception, conference rooms, hallways, etc.). That means four jobs for each 1,000 square feet equals 4,000 jobs for each million square feet, and 400,000 jobs for 100 million square feet.
The monthly job formation numbers jump all around, from 32,000 to 300,000 jobs. But, alas, these are all jobs. Sales people at Wal-Mart and burger flippers do not lease office space.
A recent New York Times headline stated, “Slow Job Growth Raises Concern on U.S. Economy.” What gives? Consider the following from the September issue of Forbes Magazine:
“In recent years, companies have been relentlessly paring back expenses, yet despite the cost-cutting, hundreds of thousands of new businesses have been created. It takes time, however, for these entities to show up on the survey radar. For example, the payroll survey finds the economy lost 1.1 million jobs since George Bush took office, while the household sampling finds the economy created a net 1.9 million new jobs.”
August brought that disparity into sharp relief. While headlines focused on the unexpectedly low 32,000 new jobs turned in by the payroll sampling, the media ignored the astonishing results of the household survey — a creation of more than 600,000 jobs. Average the two and you’ll still come up with a mighty impressive number.
Moreover, payroll surveys have been subsequently revised sharply upward after past recoveries. Some experts believe the payroll survey may be skewed, for technical reasons, because the Bureau of Labor Statistics changed the way it classifies workers by industry. Normally, the agency would conduct parallel surveys to see if there might be some unaccounted-for anomalies or glitches in that adjustment. But this wasn’t done. The reason: lack of money.
Other indicators of economic well-being support the notion that the household survey paints a more accurate picture of the labor market.
Middle-class personal incomes have risen in each of the last three years (top income earners saw their earnings decline sharply, thanks to busted stock options and the sharp decline of capital gains). Corporate profits have shown impressive growth for more than a year. Business capital spending, which fell off a cliff in 2000, is now expanding at double-digit rates.
In the past 12 months, the economy has grown at a faster rate than during any comparable period in the 1990s. It should expand at an over 4 percent pace for the rest of the year. And stocks, despite their recent sloppiness, are worth $2 trillion more than they were when President Bush signed his tax cut bill in May 2003.
People’s net worth is now higher than it was in pre-bubble-bursting 2000.
Crankiness over the economy is utterly unjustified, unless you believe John Kerry will be taking the oath of office on Jan. 20.
It brings to mind the saying, “Liars figure and figures lie.” Bottom line — we need corporate-type service sector jobs to fill office buildings, and we need a significant number each month for many months. The alternative is a continuing decline in the value of office buildings, which according to RCA will decline nationally to 4 percent in 2005.
For many of you, this discussion is interesting but trivial. The real question is: Can the Red Sox catch the Yankees? Now these are statistics worth talking about! nhbr
Bill Norton, president of Norton Asset Management, is a Counselor of Real Estate (CRE) and director of the Greater Manchester Chamber of Commerce. He also sits on the board of The Initiative for a 20/20 Vision for Concord, N.H. He can be reached at wbn@nortonnewengland.com.
At Blueline Advisors in Exeter, chief investment officer Frank Sabin is embracing AI, with the help of the students, to better serve his clients, who have entrusted about $250 million in assets in his care.

As Granite Staters eye ever-increasing purchase prices for a single-family home, state and federal policy makers wrestle with solutions that create more housing supply. Among them is bipartisan federal legislation on housing that is being held hostage by President Donald Trump’s fixation on a bill that would require voters to provide proof of citizenship with such documents as U.S. passports or birth certificates.

Two New Hampshire cities are among the 10 best-run cities in the country, according to a WalletHub analysis of U.S. communities where residents get the most bang for their taxes. Manchester was rated No. 3, while Nashua was close behind at No. 5., based on a “Quality of Services” score that WalletHub developed using 36 metrics across six key service areas — financial stability, education, health, safety, economy and infrastructure/pollution.

Business and event happenings around the state of NH

The Latest is a roundup of the comings and goings of the movers and shakers in NH's business community
A brand new and redesigned Revo Casino and Social House came back to Manchester’s land-use boards this month after the acquisition of additional nearby properties allowed the creation of an expanded vision for the project.
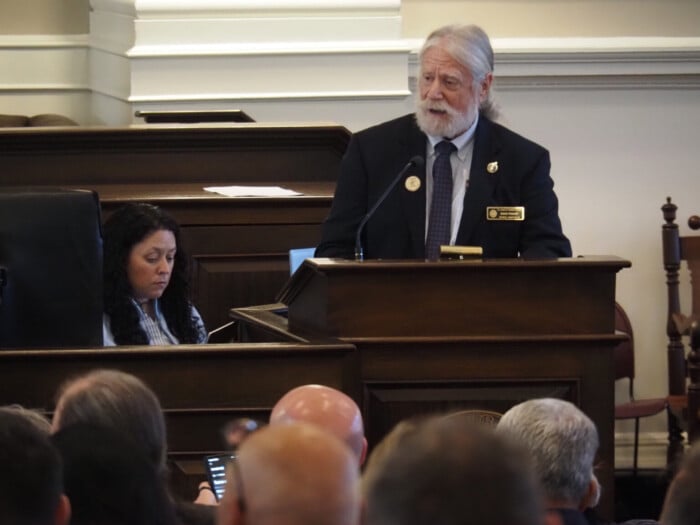
The New Hampshire House and Senate sent three bills to Gov. Kelly Ayotte intended to enable more housing construction, overcoming opposition from the New Hampshire Municipal Association and others.

HEALTH CARE By: DR. STEVEN ANGELO As more Americans live longer, maintaining brain health is becoming an increasingly important part of overall well-being. During Alzheimer’s & Brain Awareness Month, and throughout the year,…

Small and medium-sized enterprises (SMEs) make up the majority of businesses in NH and play a vital role in driving economic growth, innovation and job creation.