NH home prices buck spring-to-summer trend
In a departure from a 10-year trend, the June median price for a single-family home in New Hampshire dropped from what it was in May.
The income disparity between rich and poor is widening at a greater rate in New Hampshire than anywhere else in the nation, according to a review of the most recent U.S. Census data.
The statistics show that the Granite State is still a relative enclave of equality, thanks to its large middle class, but that middle class shrank more than anywhere else in the nation through the recession.
New Hampshire isn’t alone, of course. Inequality has been growing around the nation since the 1970s, and that growth has continued, climbing 2.6 percent nationwide from 2007 to 2013. But New Hampshire’s growth rate has been almost double that. Indeed, it is the only state where income inequality has grown more than 5 percent (5.07 percent, to be exact).
In 2007, New Hampshire was the second most economically homogenous state in the country. By 2013, according to the latest data available, it slipped to number six.
No one is sure why economic disparity is growing so sharply in the Granite State, but most feel the statistic reflects a combination of a strong surge of entrepreneurship, even during the recession, while the lower end of the spectrum remained flat.
“There are a lot of cool things that are happening in this state that benefits those at the top more than those at the bottom,” said Beth Mattingly, director of research on vulnerable families at the Carsey School of Public Policy at the University of New Hampshire. “The income of those at the bottom is not going down, but that doesn’t mean they aren’t getting poorer. Their relative position has gotten worse.”
This trend is particularly acute in the Lakes Region – Belknap and Carroll counties – and among larger municipalities, including Bedford.
This doesn’t surprise Len Campbell, who heads parish community service outreach for Catholic Charities in Laconia.
“There is a lot of pressure on the middle class here,” he said. “I know people are struggling to find food. More and more middle class people are attending community meals.”
Nor is the disparity in Bedford a surprise to economist Dennis Delay, who lives in West Manchester. While driving through Bedford, he said, “it always strikes me, seeing the housing from the ‘50s and then you see these huge McMansions.”
Increasing inequality
The increasing growth of income disparity in New Hampshire is not new. In 2007, economist Ross Gittell, now chancellor of the Community College System of New Hampshire, authored a report for Carsey. He found that between 1989 and 2004, the New England region experienced the largest increase in income inequality in the country, due to both the growth among top earners and the hollowing out of the middle class.
“This is not simply the ‘rich getting richer’,” wrote Gittell at the time. “The loss of manufacturing employment for low-skilled workers has been coupled with increased demand, and rewards, for high-skilled and high-tech employment. These shifts were more pronounced in New England because of the region’s highly educated population, strong research and development base, and relatively high cost of business operations, which pushes low-skilled jobs elsewhere.”
Indeed, that finding was one of the reasons Gittell took a job at the community college system in 2012. Even an associate degree, he said, could bump up a person’s wages by 10 percent.
“I was trying to expand middle-class opportunities, or at least slow down the rising income equality in the state,” he said.
Before he even took the job, the situation had gotten worse, according to the latest Carsey report, which was released in March.
Mattingly, who authored the report, used all sorts of data to look at the growing disparity at the younger population state by state. But one chart, based on decennial census data, augmented with the census’ American Community Survey, showed how that gap widened in New Hampshire more than elsewhere.
In 1960, the median family income of the state’s wealthiest percent was about $10,000 less than the rest of the nation. By 2010, that median (about $175,000) was more than $10,000 more. Meanwhile, the median income of the bottom 20 percent of the population – relatively flat across the country – declined slightly in New Hampshire, to less than $40,000.
Those figures are adjusted for inflation, but not the expectation of a higher standard of living. “What you need to function in society is more, not the same,” said Mattingly. “There were no cellphones or email in 1960. Now they are essential.”
Other studies confirm that New Hampshire’s disparity has been growing sharply. From 1979 to 2007, the wealthiest 1 percent in New Hampshire captured 35.5 percent of the state’s income growth, according to tax data. From 2009 to 2011 – the heart of the recession – that same group grabbed an 83.3 percent share of the income.
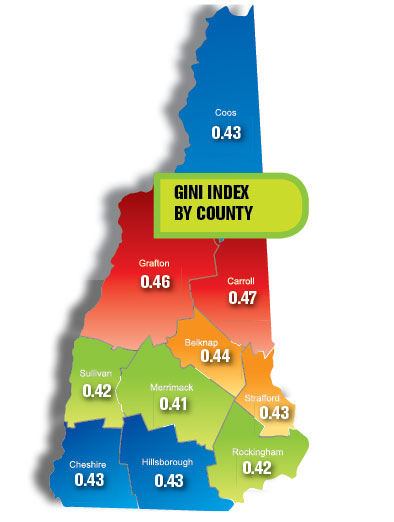
Gini index
NH Business Review looked at a more comprehensive census statistic on inequality from 2007 to 2013, based on three-year averages from the American Community Survey.
The Gini index is an international measure of inequality named after Italian statistician and sociologist Carrado Gini, who published the measuring stick of income distribution in 1912. Under the index, zero expresses perfect equality, whereas one would indicate that a single person or family had all the income and the rest of the population earned nothing.
The Gini Index does not indicate wealth or poverty. As economist Delay noted, if the entire population was destitute, it could have a very good Gini index. Internationally, the former Soviet republics of Ukraine and Slovenia had the lowest Gini index, just under 0.25, while South Africa had the highest, at 0.65. The U.S. index increased from 0.465 to 0.477 from 1997 to 2013. New Hampshire’s 0.414 index in 2007 went up to 0.435 seven years later.
Within the state, the Carroll County had the highest index (0.468) followed by Grafton (0.46) and then Belknap (0.44) but Belknap’s index grew the most between 2007 and 2013, about 10 percent, twice the disparity growth rate of the state as a whole. Merrimack County was the most equal, with a 0.41 rating, the only county where the Gini Index went down.
Among the 14 larger municipalities, Keene had the highest index, at 0.47, followed by Bedford, 0.45.
But Bedford’s rate was the fastest-growing, at 18.25 percent, followed by Hudson, with a 17.54 percent growth rate, though the latter has the second lowest Gini index in the state. Experts are quick to point out that the margin of error is greater in municipalities, even the larger ones.
Larger demographic trends can also throw off the Gini index. An aging population generally increases it, and New Hampshire has been aging, noted Ken Johnson, a Carsey School demographer. In addition, the state hasn’t had the influx of people it has in the past, and that influx has tended to increase the size of the middle class.
This change be particularly true in the Lakes Region, which has an aging population, said Campbell, where there are wealthier retirees settling on the lake, poorer ones on fixed income and lower-wage people in industries that serve them.
“You don’t hear about a lot of middle class people moving into the area,” Campbell said. Indeed, many of the young professionals are fleeing. “My kids aren’t staying. For them to get a job that they want to do, it’s not often here in New Hampshire.”
Another possible explanation of stagnation at the bottom is that “we are the only state in the region where the minimum wage is tethered to the federal,” said Arnie Albert, co-director of the American Friends Service Committee. While not many people are paid the minimum in New Hampshire, the absence of a higher wage tends to pull down the wages of everybody else on that rung, he said.
“There has been an economic recovery, but it has mainly been for the people at the top,” he said.
Bob Sanders can be reached at bsanders@nhbr.com.
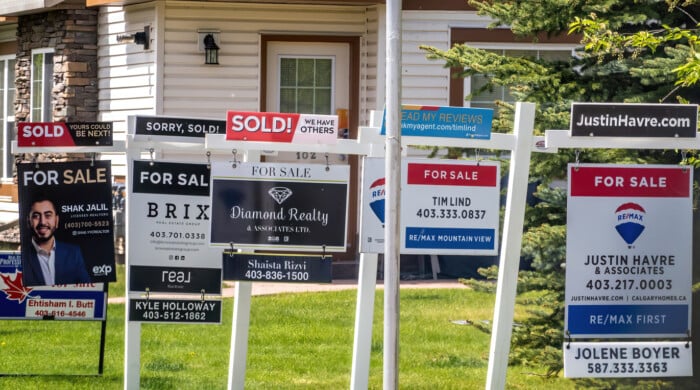
In a departure from a 10-year trend, the June median price for a single-family home in New Hampshire dropped from what it was in May.
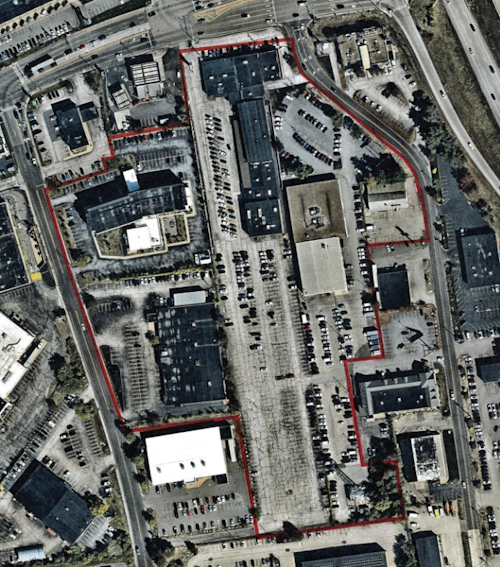
The 110-acre Village at Technology Park off Harvey Road in north Londonderry will include space for industrial, residential, childcare and retail.
At Blueline Advisors in Exeter, chief investment officer Frank Sabin is embracing AI, with the help of the students, to better serve his clients, who have entrusted about $250 million in assets in his care.

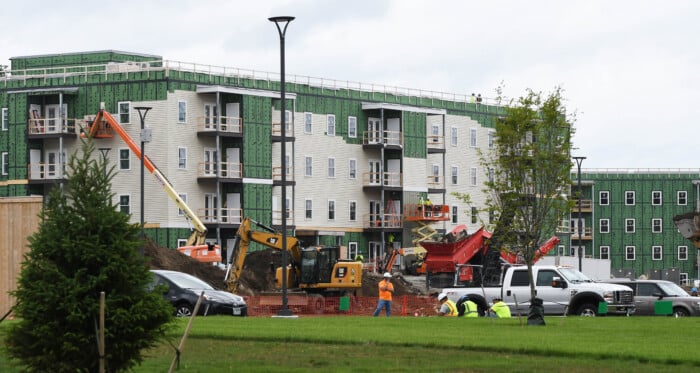
As Granite Staters eye ever-increasing purchase prices for a single-family home, state and federal policy makers wrestle with solutions that create more housing supply. Among them is bipartisan federal legislation on housing that is being held hostage by President Donald Trump’s fixation on a bill that would require voters to provide proof of citizenship with such documents as U.S. passports or birth certificates.

Two New Hampshire cities are among the 10 best-run cities in the country, according to a WalletHub analysis of U.S. communities where residents get the most bang for their taxes. Manchester was rated No. 3, while Nashua was close behind at No. 5., based on a “Quality of Services” score that WalletHub developed using 36 metrics across six key service areas — financial stability, education, health, safety, economy and infrastructure/pollution.

Business and event happenings around the state of NH

The Latest is a roundup of the comings and goings of the movers and shakers in NH's business community
A brand new and redesigned Revo Casino and Social House came back to Manchester’s land-use boards this month after the acquisition of additional nearby properties allowed the creation of an expanded vision for the project.
The New Hampshire House and Senate sent three bills to Gov. Kelly Ayotte intended to enable more housing construction, overcoming opposition from the New Hampshire Municipal Association and others.