Overcoming skepticism, putting AI to work
At Blueline Advisors in Exeter, chief investment officer Frank Sabin is embracing AI, with the help of the students, to better serve his clients, who have entrusted about $250 million in assets in his care.
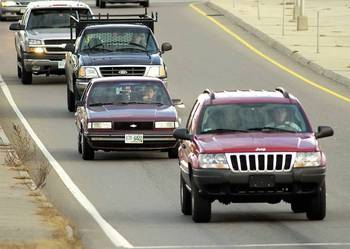
Here’s a surprise for you: The U.S. Census Bureau says New Hampshire doesn’t like SUVs as much as the rest of the country and nowhere near as much as Vermont.
Find that unusual?
So do people in the business.
“I’m shocked by the numbers. I’m really surprised,” said Kevin Milligan, owner of Downtown Lincoln-Mercury in Nashua.
“It’s confusing data to me,” said Jack Tulley of the Tulley dealership in Nashua, who as state director for the National Automobile Dealers Association has a lot of experience with car-related statistics.
SUV registration in New Hampshire grew 17 percent from 1997 to 2002, according to Census Bureau data released Thursday. Nationally over that period, SUV registrations grew more than three times as fast, or 56 percent.
It gets more confusing.
According to the Census Bureau, New Hampshire shares its low-growth SUV status with little, urban Rhode Island; big, rural Wyoming; and big, urban Arizona. It would be hard to find four states with less in common.
Even more surprising are the results for our neighbors. The Census Bureau said Maine also had low SUV growth (19 percent), but Massachusetts’ growth was average at 44 percent, and Vermont went hog-wild with a 74 percent hike.
Why would Vermont be turning to SUVs four times faster than Maine or New Hampshire?
Good question.
“I have a home in Vermont, too, and they lean much more toward domestic manufacturers than we do here in New Hampshire,” Tulley said. “But that’s all I can think of.”
An examination of national patterns reported Thursday in the Vehicle Inventory and Use Survey, which covered the five years up to 2002, will also cause some head-scratching.
Many of the highest-percentage increases were in southern states such as Tennessee and Texas, leading to the idea that places that hadn’t previously needed SUVs to cope with winter roads began turning to them for trendy reasons.
But Arizona and Florida, which fit that pattern, were well below the national average in SUV growth, while Michigan, Minnesota and Vermont – places that needed four-wheel drive long before S and U were attached to V – were way above the national average.
What all this means is that these state-by-state comparisons, part of a broader national economic survey, should be taken with a pinch of road salt.
Right off the bat, there’s a reason for Granite Staters to downplay the results: New Hampshire’s report was the only one of 51 (including the District of Columbia) that used data from September 2001 instead of July 2002.
This came about, says a footnote in the 62-page state report, “due to difficulty in obtaining up-to-date registration records for New Hampshire.”
So New Hampshire’s increase is short nine months’ worth of growth compared to everybody else.
Another note of caution is that the results are based on self-reported surveys and contain a margin of error. The smaller the sample – such as when looking at results from low-population states – the greater the possible error.
The Census Bureau hired R.L. Polk, which gathers automobile data for the National Automobile Dealers Association, to send out surveys to a random sample of people in each state who had registered trucks.
Nationwide, 136,000 forms were sent, out of almost 80 million registrations. In New Hampshire, 3,232 surveys were sent out, and 78 percent were returned.
Among other things, the survey asked people to say what kind of truck they had: pickup, minivan, SUV or a full-sized van. The percentage who said they owned an SUV was then multiplied by the total number of truck registrations in each state to create an estimate for SUV registrations.
Because it’s an estimate based on a sampling it carries a margin of error. The smaller the sample size, the bigger the margin.
Tiny Vermont had one of the smallest samplings in the country, so perhaps its numbers are skewed by chance.
The Census Bureau gathers these numbers not to fuel intrastate vehicular arguments but to add to the big picture on national economic trends.
The survey delved into such details as numbers of axels, miles driven weekly, and whether the vehicle is a “van, insulated, refrigerated” or a “van, insulated, non-refrigerated.”
Taken in bulk, such data helps economists and government officials make decisions about everything from industrial production to road construction to pollution controls; taken in pieces, it can sometimes produce misleading conclusions.
BY THE NUMBERS
Here is a ranking of the states that showed the largest and smallest percentage change in SUV registrations between 1997 and 2002. One note of caution: the New Hampshire figure is based on data through September 2001 instead of July 2002, “due to difficulty in obtaining up-to-date registration records for New Hampshire,” according to the U.S. Census Bureau.
TOP 5
Tennessee+150.8 percent
Georgia+114.3 percent
Indiana+103.4 percent
Iowa+97.1 percent
Texas+96.6 percent
BOTTOM 5
Rhode Island-2.2 percent
Wyoming+5.8 percent
Arizona+12.5 percent
New Hampshire+17.1 percent
Connecticut+18.5 percent
SOURCE: U.S. Census Bureau

At Blueline Advisors in Exeter, chief investment officer Frank Sabin is embracing AI, with the help of the students, to better serve his clients, who have entrusted about $250 million in assets in his care.

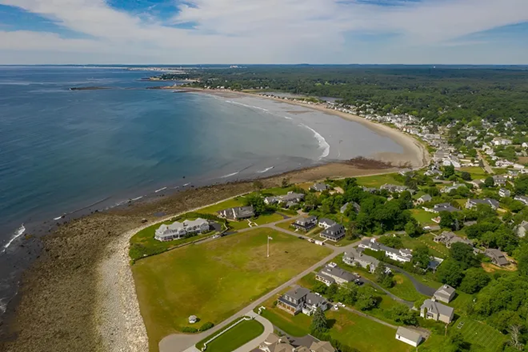
As Granite Staters eye ever-increasing purchase prices for a single-family home, state and federal policy makers wrestle with solutions that create more housing supply. Among them is bipartisan federal legislation on housing that is being held hostage by President Donald Trump’s fixation on a bill that would require voters to provide proof of citizenship with such documents as U.S. passports or birth certificates.

Two New Hampshire cities are among the 10 best-run cities in the country, according to a WalletHub analysis of U.S. communities where residents get the most bang for their taxes. Manchester was rated No. 3, while Nashua was close behind at No. 5., based on a “Quality of Services” score that WalletHub developed using 36 metrics across six key service areas — financial stability, education, health, safety, economy and infrastructure/pollution.

Business and event happenings around the state of NH

The Latest is a roundup of the comings and goings of the movers and shakers in NH's business community
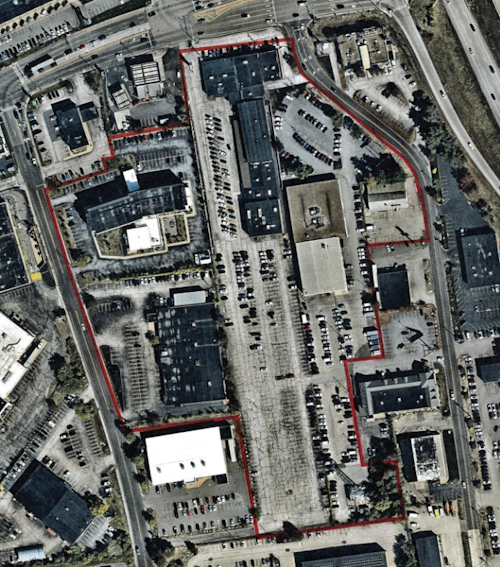
A brand new and redesigned Revo Casino and Social House came back to Manchester’s land-use boards this month after the acquisition of additional nearby properties allowed the creation of an expanded vision for the project.
The New Hampshire House and Senate sent three bills to Gov. Kelly Ayotte intended to enable more housing construction, overcoming opposition from the New Hampshire Municipal Association and others.

HEALTH CARE By: DR. STEVEN ANGELO As more Americans live longer, maintaining brain health is becoming an increasingly important part of overall well-being. During Alzheimer’s & Brain Awareness Month, and throughout the year,…

Small and medium-sized enterprises (SMEs) make up the majority of businesses in NH and play a vital role in driving economic growth, innovation and job creation.