‘Honor Summit’ to illuminate Mount Washington to commemorate Sept. 11, 2001, attacks
Nonprofit founded by businesswoman Renee Plummer raising funds to help veterans
New Hampshire has the seventh-highest concentration of millionaire households in the United States, according to a newly released report.
Rhinebeck, N.Y.-based Phoenix Marketing International reports in its annual Wealth & Affluent Monitor that 6.82 percent of New Hampshire households are millionaire households. The state held the same No. 7 spot in the 2015 rankings.
Nationally, the number of millionaire households has grown by more than 800,000 over the past five years and by more than 1.3 million since 2006, before the financial crisis, according to the report. But while the overall wealth market is growing, the ratio of millionaires to total U.S. households has remained relatively flat, meaning wealth is more concentrated and shifting geographically, said David Thompson, managing director, affluent practice, at Phoenix.
In fact, he said, the concentration of wealth in the U.S. continues to deepen as the top 1 percent of wealthiest U.S. households now holds 24 percent of the nation’s liquid wealth, while non-affluent households, representing 70 percent of U.S. households, control less than 10 percent.
Thompson said the research show that “the trends we’ve seen over the past 10 years show a deeper and wider wealth divide as families in the near- and emerging affluent segments fall further behind financially.”
The Phoenix report found that nearly 6.8 million U.S. households, approximately 5.5 percent of all U.S. households, had $1 million or more in investable assets – a 4 percent one-year increase in the number of millionaire households, or nearly 250,000 more households than in 2015. Nevertheless, over the past five-year and 10-year periods, the ratio of millionaire households to total U.S. households has remained relatively flat, up from 4.8 percent in 2006 and 5.1 percent in 2011.
By comparison, there are 16.4 million households in the “broad affluent” market (households with between $250,000 and $1 million in investable assets). They control $8.5 trillion in investable assets, or 35 percent of total liquid wealth in the U.S.; however, they lost $56 billion collectively between 2015 and 2016, according to the report. The vast majority of the losses ($54 billion) were among the “lower mass affluent” segment (households with $250,000 to $500,000).
In addition, the report found that the 14 million “near-affluent” households in the U.S. (with between $100,000 and $250,000) saw investable assets decline by $79 billion between 2015 and 2016, to $2.6 trillion.
According to the report, the 10 states with the highest percentage of millionaire households are:
1. Maryland (7.55 percent)
2. Connecticut (7.4 percent)
3. New Jersey (7.39 percent)
4. Hawaii (7.35 percent)
5. Alaska (7.15 percent)
6. Massachusetts (6.98 percent)
7. New Hampshire (6.82 percent)
8. Virginia (6.64 percent)
9. Washington, D.C. (6.32 percent)
10. Delaware (6.28 percent)

Nonprofit founded by businesswoman Renee Plummer raising funds to help veterans

Hybrid and remote work models continue to boom in the Granite State

Supporters of fewer restrictions on cannabis in NH see glimpse of a possible future

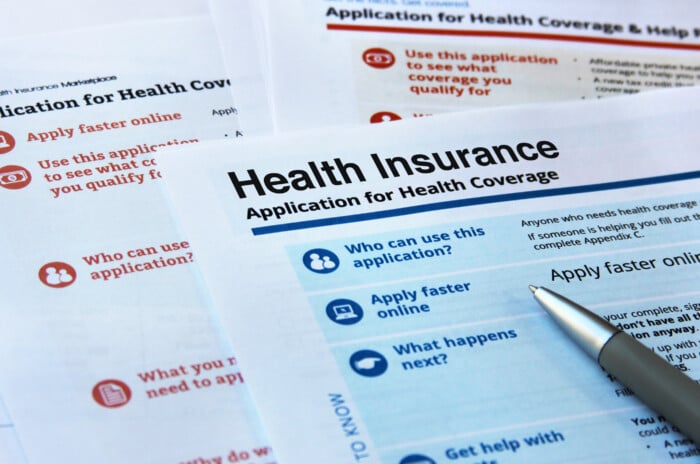
Access to healthcare is more than an employee recruiting or retention tool. It is one of the largest line items on the balance sheet and a critical factor in workforce stability.
A 25-person tech company in Manchester, Vibrac Precision Test Systems, anticipates explosive growth as the United States and Europe move to expand their stockpiles of Patriot defense missiles.

House Bill 707, signed into law by NH Gov. Kelly Ayotte, promotes expanding existing landfills, rather than building new ones, and also establishes a seven-member committee to evaluate landfill sites.
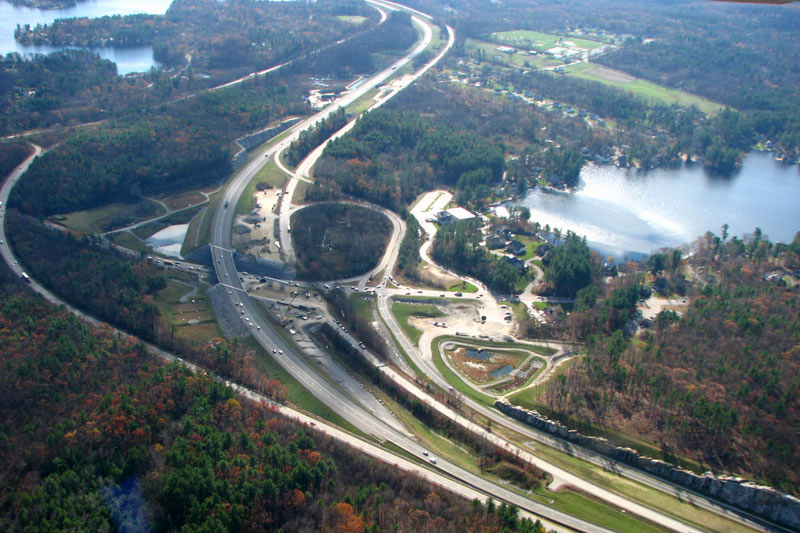
The state’s highway infrastructure is in great need of repair, according to a 2026 independent report that ties the improvements directly to the health of New Hampshire’s economy. Long-term needs are currently underfunded, says TRIP (The Road Information Program), a private, nonprofit organization that researches surface transportation issues across the country.

Business and event happenings around the state of NH

The Latest is a roundup of the comings and goings of the movers and shakers in NH's business community